Opallite has no revenue, no customers and no shipped product, so there is no past to extrapolate from. Every number I wrote for the market, the plan and the money is a target, an estimate or my own arithmetic. Here is how those numbers fit together, and where two sets of my own numbers did not.
The market: three circles
Slide 5 of the deck uses the usual three layers:
- TAM, the total market: "$67B + X⁴", for 2D and 3D digital art, photography and animation.
- SAM, the part I could reach: $13B, for homes, businesses and collectors.
- SOM, the share I aim to win: $15M as a three-year target, "30k+ units sold".
The chart beside the circles puts two growth lines on one axis: the digital art market at 14.3% CAGR and the digital display market at 4.5%. I did not find a cited source for any of these in my files. They are estimates.
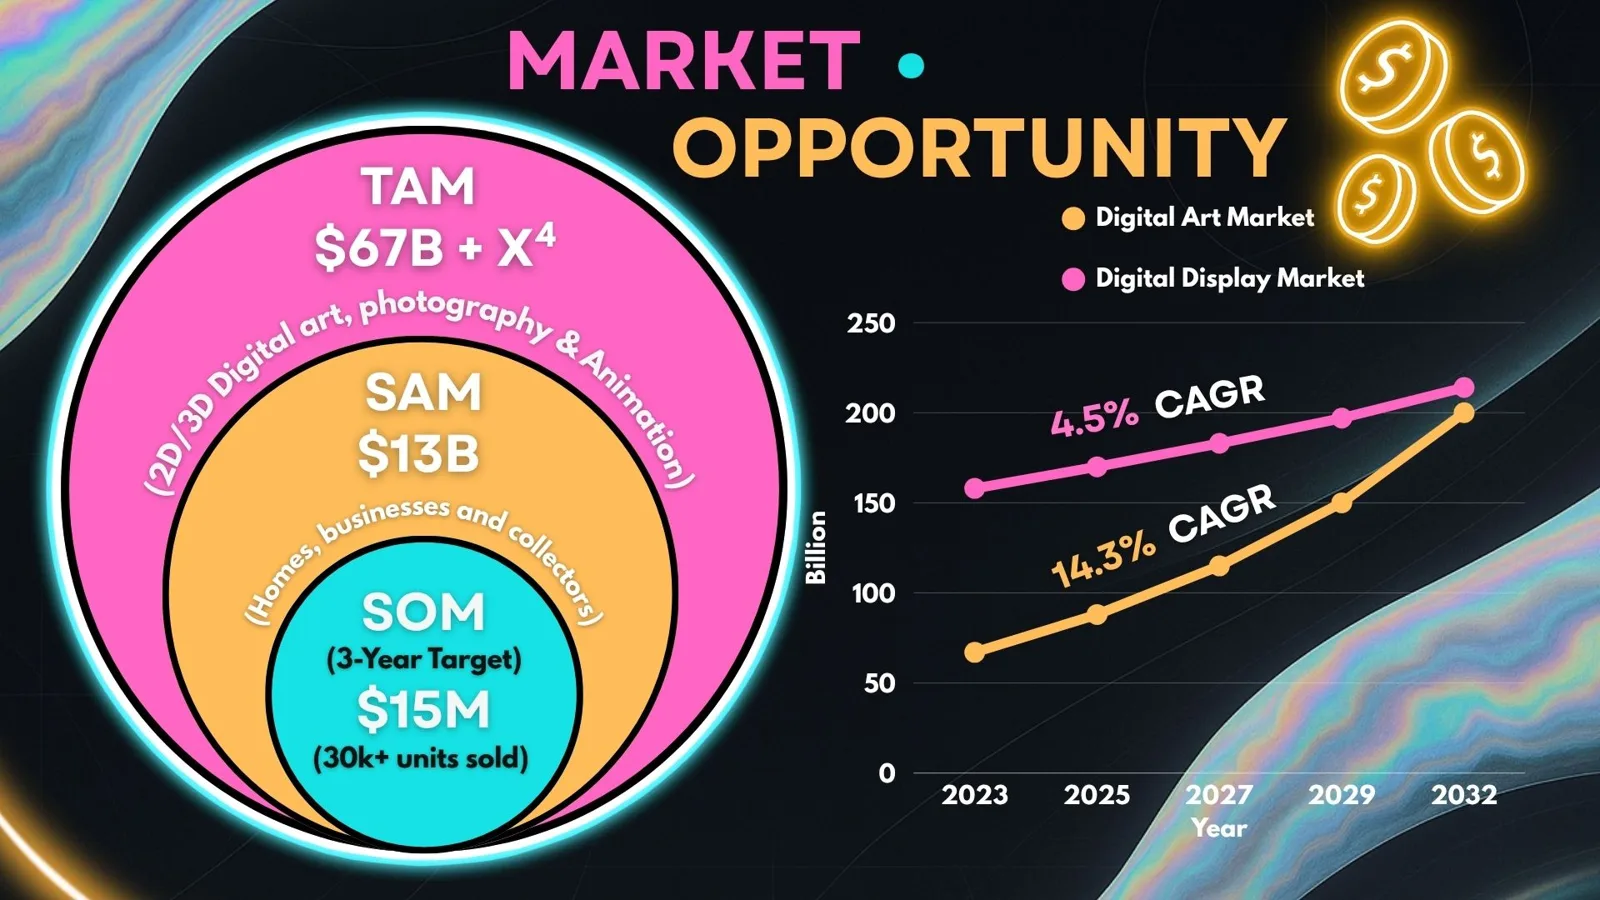
The SOM is the one I can test against my own arithmetic. $15M over 30,000 units is $500 a unit. That sits inside slide 6's price range for the 4K OLED canvas, $499 to $1,199. A consistency check on a target, nothing more.
The three-year plan
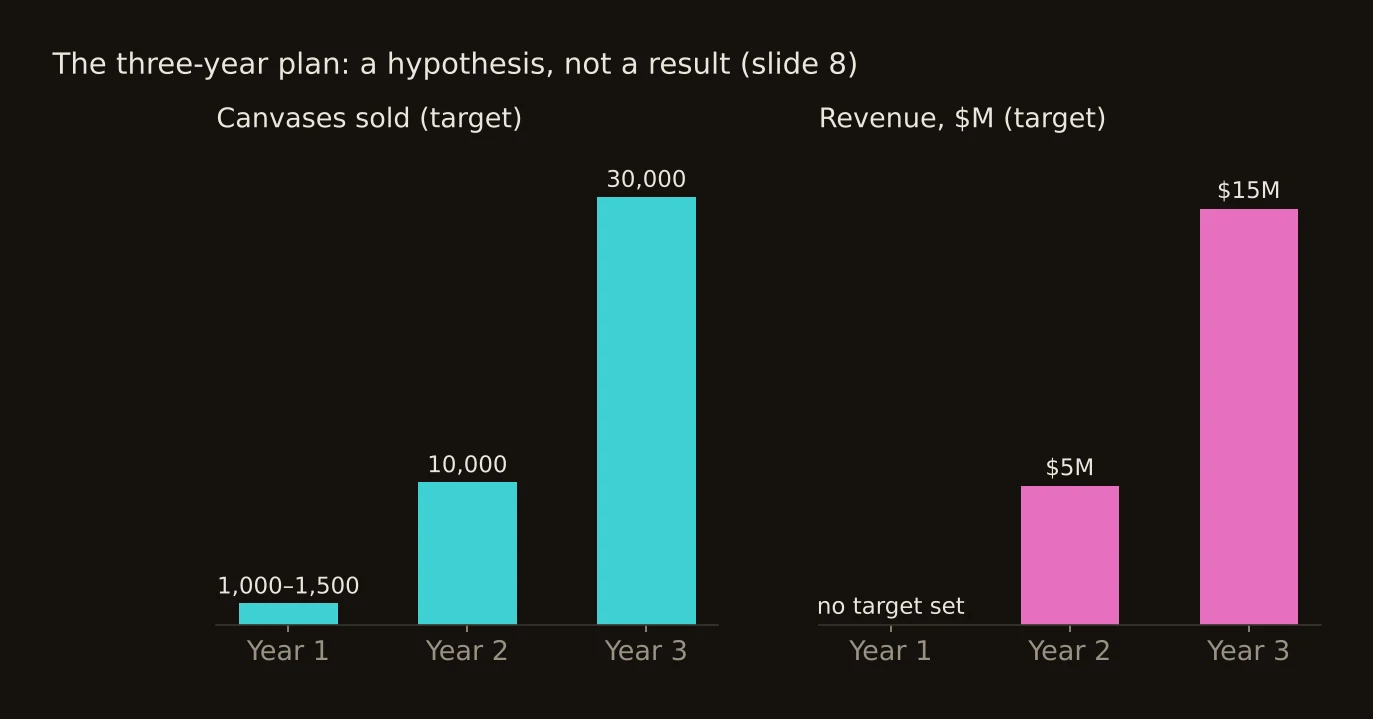
Slide 8 turns the market into milestones:
- Year 1: MVP launch, 1,000-1,500 units sold, 500 artists onboarded. No revenue target is set.
- Year 2: modular features and retail partnerships, 10,000 units, $5M revenue.
- Year 3: industry integrations in film, gaming and other media, 30,000 units, $15M revenue.
Years 2 and 3 both work out to $500 a unit, so the slide is at least consistent with itself.
The ask
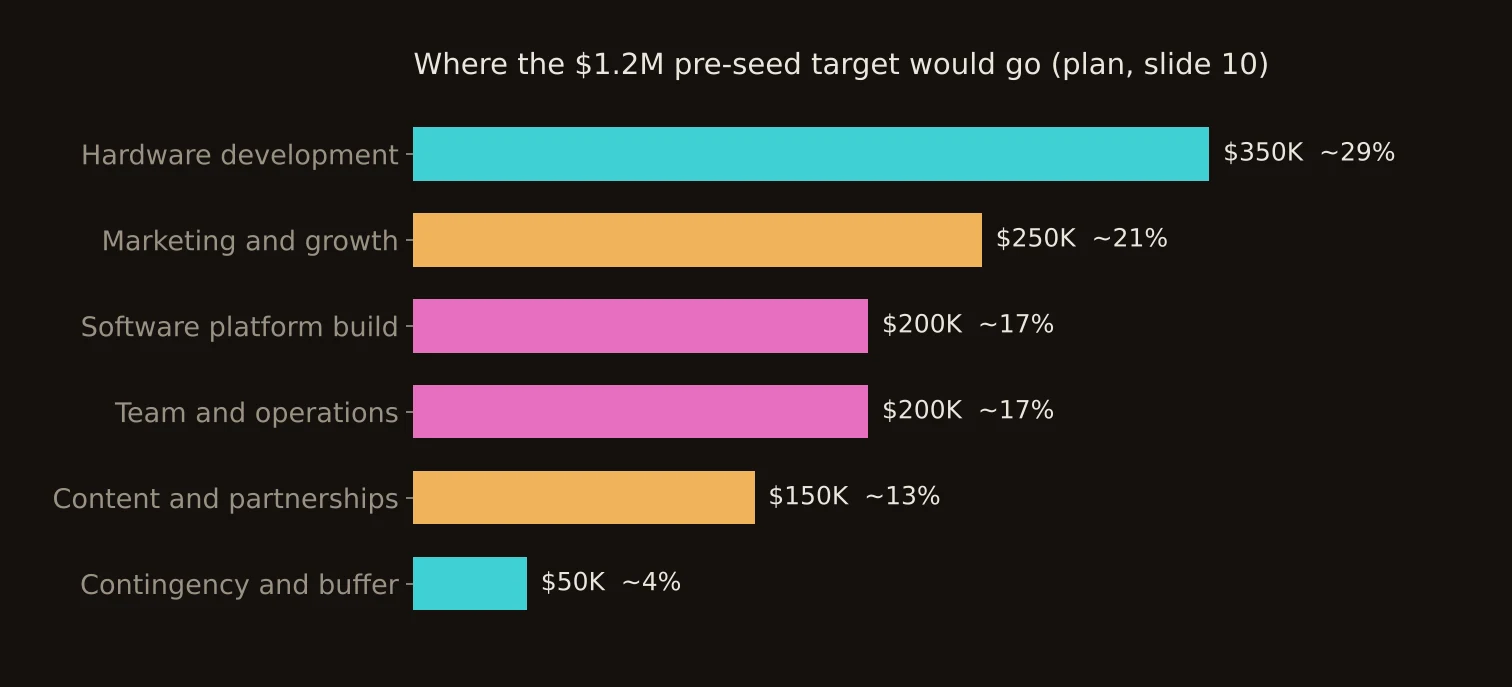
Slide 9 states the ask: a $1.2M pre-seed target to complete MVP development, run pilots in key venues and ship the first 1,000-1,500 units. That is the same 1,000-1,500 as Year 1 on slide 8. Slide 10 splits the $1.2M:
- Hardware development: $350,000 (about 29%)
- Marketing and growth: $250,000 (about 21%)
- Software platform build: $200,000 (about 17%)
- Team and operations: $200,000 (about 17%)
- Content and partnerships: $150,000 (about 13%)
- Contingency and buffer: $50,000 (about 4%)
The rows add to exactly $1.2M. My arithmetic on the hardware line: $350,000 across 1,000-1,500 units is $233 to $350 a unit, and that money also has to pay for final design, prototyping and tooling. Slide 6's manufacturing cost for a 4K OLED canvas is $250-550, and for 4K LCD $85-280. The hardware line only works if the cheaper end of those ranges holds. That is a real tension in the plan, and I would rather see it now than after raising.
The longer plan, and the charts that disagreed
The deck is the short version. The full business plan projects five years in three scenarios. In Chapter 7 the base case reaches $903M of revenue in Year 5, the conservative case $513M and the optimistic case $1,172M.
Separately I wrote two Python scripts to draw revenue charts. One works from five revenue streams and a ramp across five years. The other lists art categories, from photography to commissions, puts a market size beside each and assumes a flat share of it, such as 3% of photography or 5% of 2D and 3D art. Its ramp is one curve: 5%, 15%, 35%, 65% and 100% of the Year 5 figure.
Laid side by side for this series, they do not match:
| Source | Year 5 revenue |
|---|---|
| Chapter 7 base case | $903M |
| Consolidated chart script | about $11.5B |
| Detailed chart script | about $12.2B |
That is a gap of roughly thirteen times. One script also had a smaller error: a comment said its five digital-content categories add up to $8,100M, while the values typed in add up to $12,242M.
My best reading is that the scripts count a share of the whole market's sales volume, while the plan's marketplace line counts only the commission, roughly 12 to 20 percent of a sale. If so, the charts show how much art could pass through the platform, not what the company would earn. They are ceilings, not a profit and loss.
The plan has more splits to heal: two commission schedules, two subscription tier tables and hardware priced four different ways. An earlier draft pitch deck carried different market sizes again ($12.04B, $4.63B and $46.3M), so that draft and slide 5 disagree too.
What I take from it
- Say what the number counts. Revenue, sales volume and market size are different things. A chart can be correct arithmetic and still answer the wrong question.
- Keep one source of truth. I had one model in a document and another in code. When they diverged, nothing warned me.
- Check sums. The 8,100 against 12,242 error sat in a code comment that nothing tested.
- Ask for a number you can defend. The deck asks an investor to believe $15M in Year 3, not billions.
Next I would pick one definition of revenue, rebuild the charts from the plan's inputs, and attach a source or an explicit "my assumption" to every market figure. Until then the deck's numbers are plans and the charts are sketches.
